Start Searching with Explorazor
Explorazor is a data exploration and analysis tool where Brand Managers get an integrated view of all their datasets, obtain instant data pivots, and test out hypotheses much faster than otherwise.
Let's get started!
There are multiple features available on Explorazor that enable easy exploration of your data. Let’s dive right into a tour of how to use the search functionality to answer questions about your data on-the-fly.
Select your data
a. Firstly, select the data you want to explore from the left panel 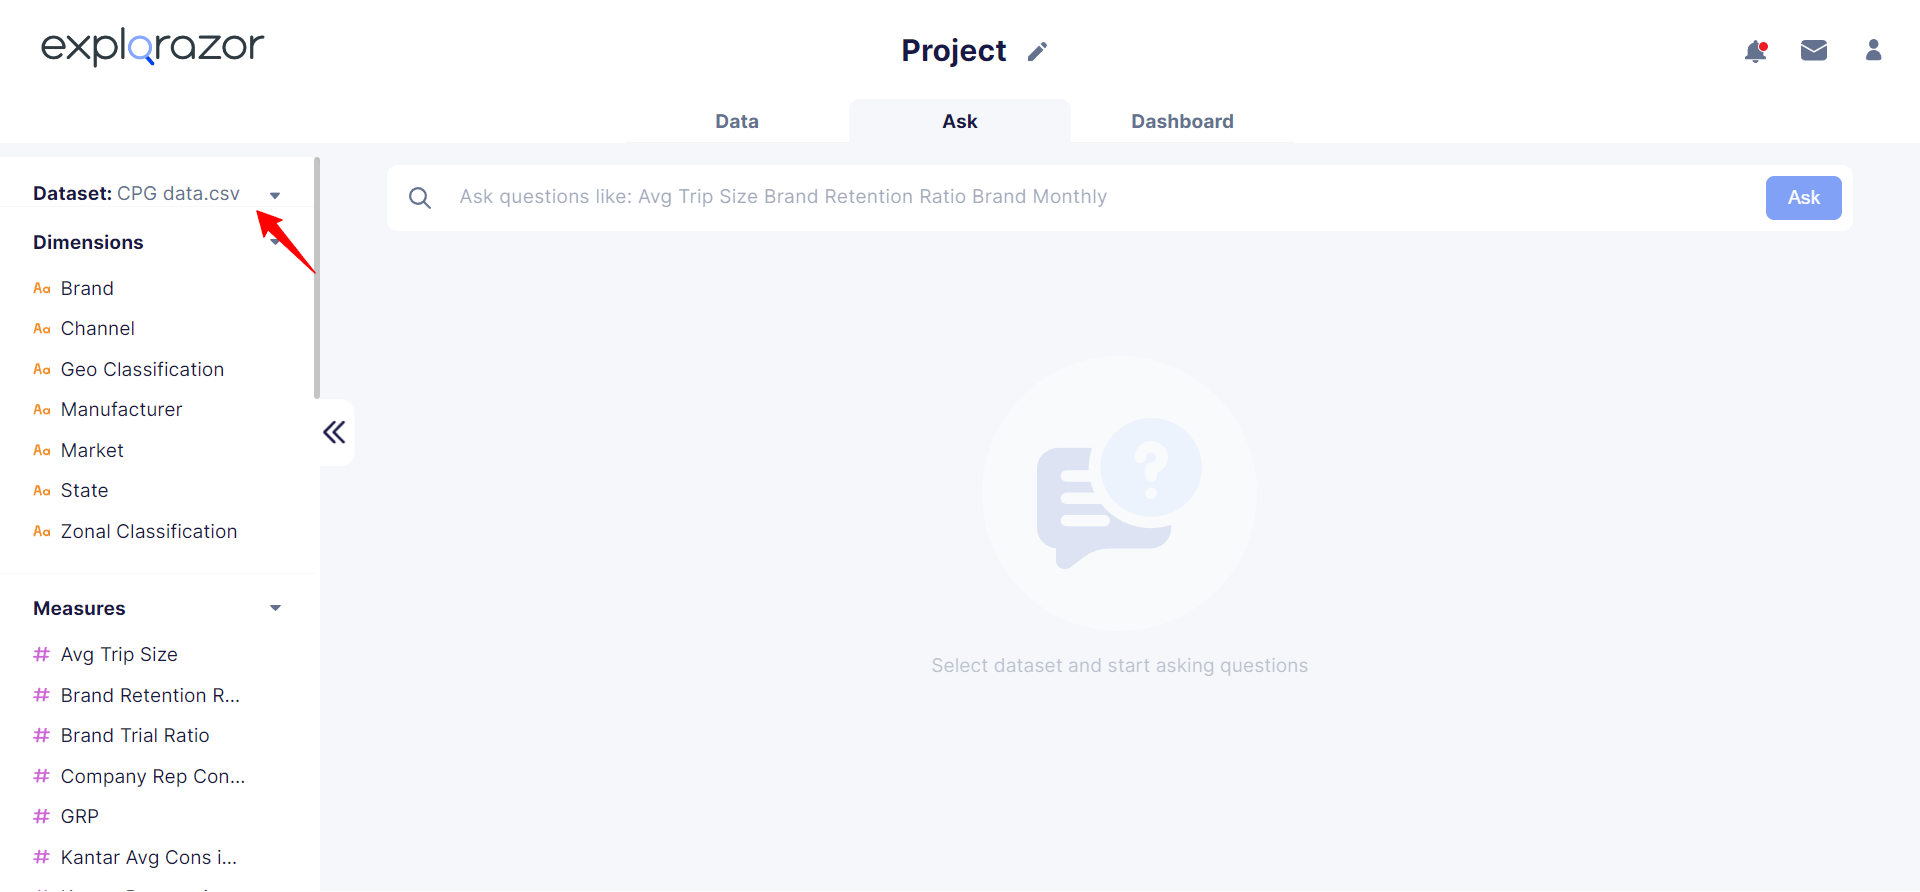 b. If there are multiple data points present in your dataset, you can always switch between multiple datasets in a single project
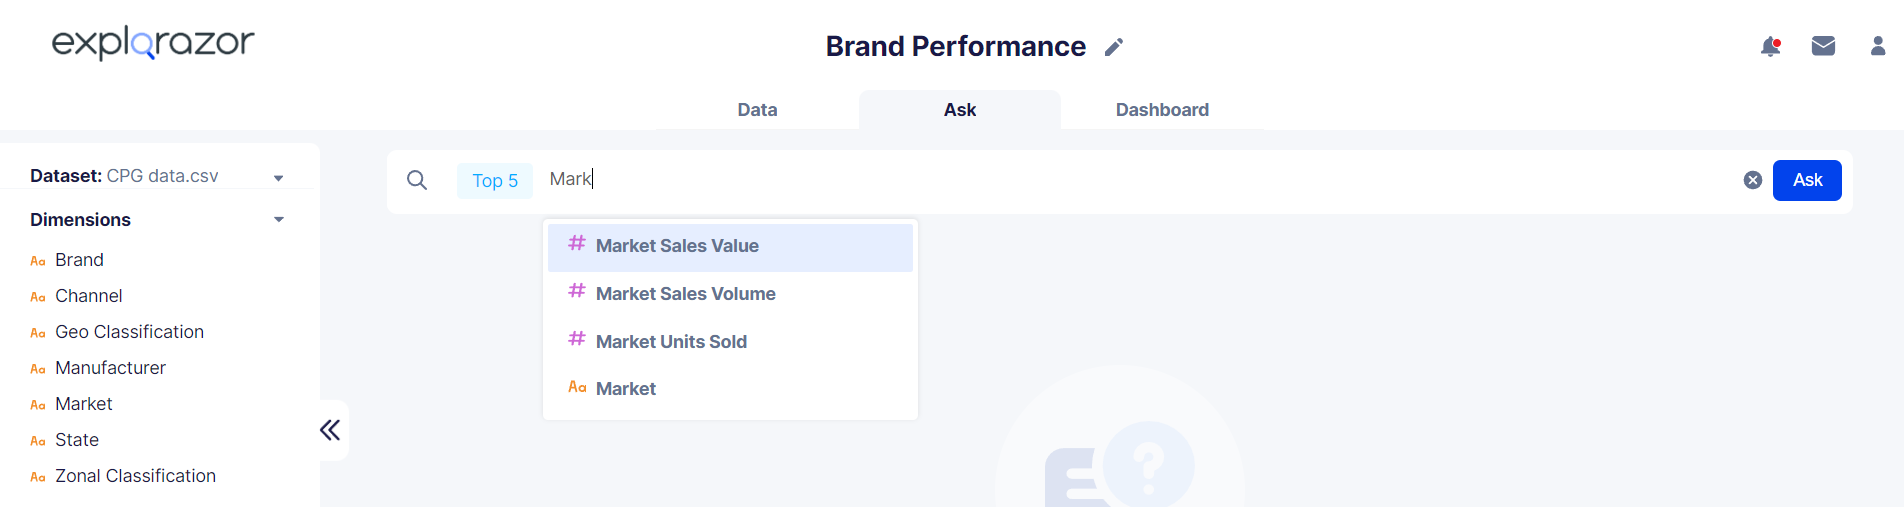
Begin Searching
The search bar is designed to make it easy for you to
a. Identify your search terms and
b. Search data cuts
Type in the search bar for the type of data cuts you are looking for and it will give you a response in the form of a table.
For example, you can search for the ‘Top 5 brands by market sales this quarter’ as shown below
In addition to the tables that exist in your data, Explorazor search also supports special keywords.
You can create your search query by creating a combination of:
- Field names of the data that you want to look at. For example, State, Products, etc
- Field values of available columns like North, Toddler category, Healthcare, etc. which applies as a filter to generate the desired result. These can also be added directly from the left panel
- Special keywords (refer Keywords section) like Top, bottom, today, this month, etc
- Different aggregations are applied to measure columns like average Sales, count Products, etc.
Start exploring your data
-
Click in the search box and start typing some text to add fields for your search

-
On typing, you will be prompted with a suggestion box to help you select matching field names, field values, or keywords you are looking for. Select the suitable item from the suggestions - your search query will be created
-
Click on Ask or press enter to get a response table and a response will be generated in the form of a table or a chart.

-
Click on the Pin icon at the top to save it to your dashboard or download the CSV file of the table response

-
To start a new query, click on the cross button on the right of the search box to erase your current query. You can also edit the existing query by deleting the non-required keywords by simply hovering over and canceling them
